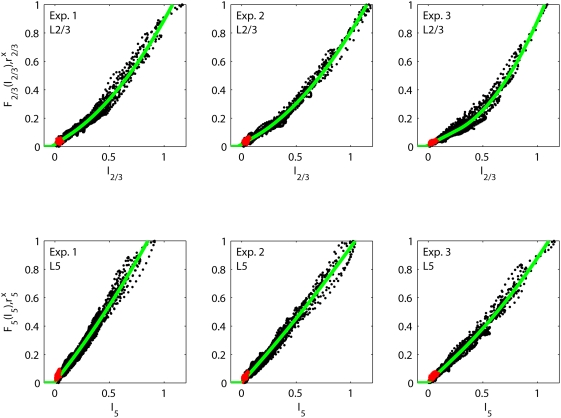
Figure 11. Fits of intracortical model.
Illustration of fits of the intracortical model (Eq. 11) to data from
experiments 1–3. Each dot corresponds to the experimentally
measured layer-2/3 firing rate  (upper row) or layer-5 firing rate
  (lower row) at specific time points
  plotted against the fitted model values of
  or
or  , respectively. The red dots are the corresponding
experimental data points taken from the first 5 ms after stimulus onset
(for all 27 stimuli). These data points show the activity prior to any
stimulus-evoked thalamic or cortical firing and represent background
activity. The solid green curves correspond to the fitted model
activation functions
  (upper row) and
  (lower row), respectively.

