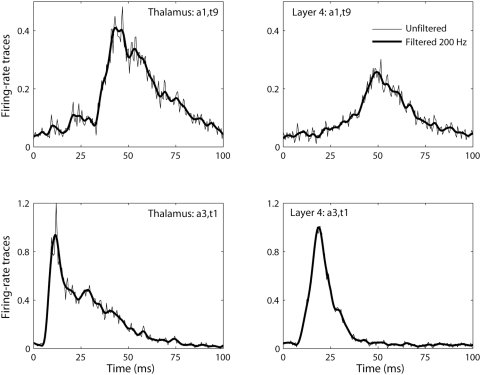
Figure 13. Effects of filtering on population firing-rate estimates.
Example trial-averaged firing-rate traces, both unfiltered and filtered,
from experiment 1 for the thalamic and layer-4 populations for a weak ( ) and a strong stimulus (
 ). The unfiltered layer-4 traces correspond to
  , cf. Eq. (16), while the layer-4 filtered traces
correspond to the firing-rate estimate
  described in Eq. (17). The unfiltered thalamic traces
represent the raw single-electrode MUA data. The relationship to the
thalamic firing-rate estimate
  is described by Eq. (17).

