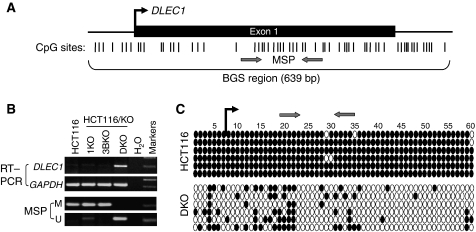
Figure 1.
Identification of DLEC1 as a methylated gene in CRC (HCT116) cells. (A) Schematic illustration of the DLEC1 promoter and its CGI. Locations of the exon 1 (indicated with a long rectangle) and CpG sites (short vertical lines) in the CGI are shown. The transcription start site is indicated by a curved arrow. (B) Genetic demethylation reactivated DLEC1 expression in DKO cells. U: unmethylated; M: methylated. (C) Detailed BGS analysis confirmed the MSP results. Methylation status of each individual promoter allele was shown as a row of CpG sites sequenced from each bacterium colony. Filled circle, methylated; open circle, unmethylated.

