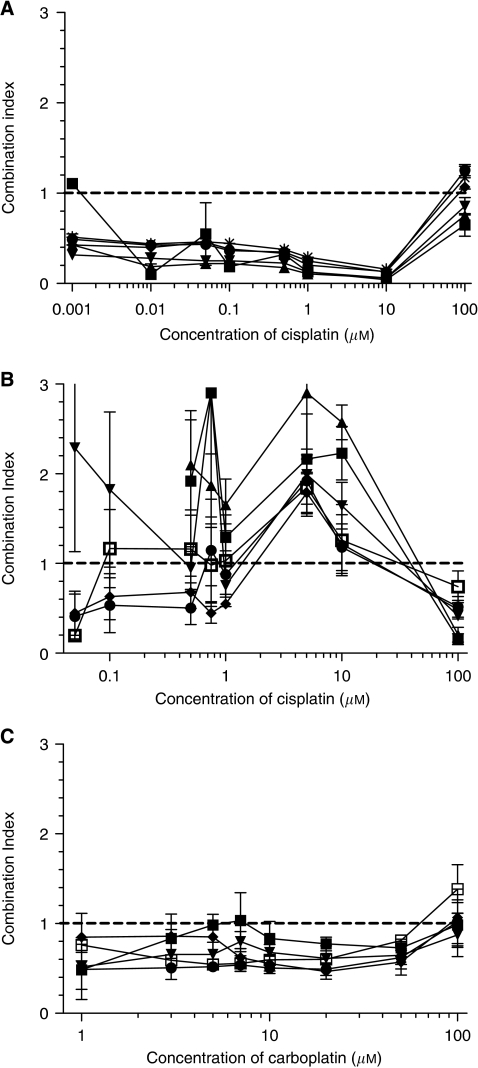
Figure 2.
Combination indices (CI, mutually non-exclusive) for cisplatin and phenoxodiol in (A) DU145 and (B) PC3 prostate cancer cells, and (C) carboplatin and phenoxodiol in DU145. CI<1 denotes synergism, CI=1 additivity and CI>1 antagonism. Combination indices >3 are not shown. Phenoxodiol concentrations in (A), (B) and (C) are as follows: ▪ 0.1 μM, ▴ 1 μM, ▾ 3 μM, ♦ 5 μM, • 7 μM, * 10 μM and □ 20 μM. All cells were exposed to simultaneous drug combinations for 72 h. The horizontal dashed line highlights CI=1.

