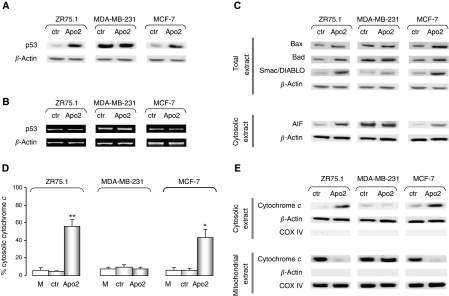
Figure 4.
Effects of Apollon downregulation on mitochondrial apoptotic pathway. Representative (A) western blot and (B) RT–PCR experiments showing the expression of p53 protein and mRNA, respectively, in ZR75.1, MDA-MB-231 and MCF-7 cells 72 h after transfection with ctr and Apo2 siRNAs. (C) A representative western blot experiment showing the expression of proteins involved in the mitochondrial pathway, in ZR75.1, MDA-MB-231 and MCF-7 cells 72 h after transfection with ctr and Apo2 siRNAs. (D) Cytochrome c release as determined by ELISA in ZR75.1, MDA-MB-231 and MCF-7 cells 72 h exposed to mock control or transfected with ctr and Apo2 siRNAs. Data are expressed as percentage values of cytosolic cytochrome c with respect to the total amount of cytosolic and mitochondrial cytochrome c, and represent the mean values±s.d. of at least three independent experiments. *P<0.01 and **P<0.001 vs mock control. (E) A representative western blot experiment showing the abundance of cytochrome c in mitochondria and cytosolic fractions in ZR75.1, MDA-MB-231 and MCF-7 cells 72 h after transfection with ctr and Apo2 siRNAs. β-Actin and COX IV were used to confirm equal protein loading and to show the relative purity of the cytosolic or mitochondrial fractions. AIF=apoptosis inducing factor; siRNA=small interfering RNA.

