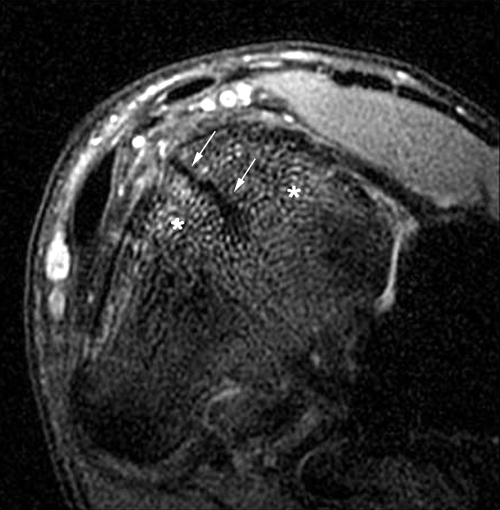
Figure 3 Case 1: grade 4 tarsal navicular stress fracture. Coronal DP fat suppressed image (TR1900/TE47) shows bone marrow oedema as diffuse signal enhancement. The linear hypointense image represents the fracture line (white arrows) involving the dorsal cortical oriented in the sagittal plane through the upper two third of the navicular bone.

An official website of the United States government
Here's how you know
Official websites use .gov
A
.gov website belongs to an official
government organization in the United States.
Secure .gov websites use HTTPS
A lock (
) or https:// means you've safely
connected to the .gov website. Share sensitive
information only on official, secure websites.
