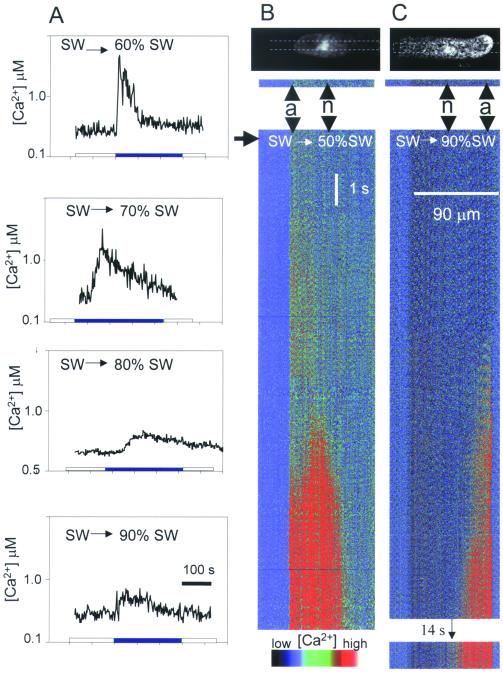
Figure 1.
Patterns of cytosolic Ca2+ signals in response to different degrees of hypo-osmotic shock. (A) Ratio photometric recordings of average global cell Ca2+ monitored with fura-2-dextran (13) in rhizoid cells in response to transfer from 100% SW to 60% (n = 7), 70% (n = 20), 80% (n = 20), or 90% (n = 3) SW. (B and C) Sequential plots of confocal sections (shown on the Calcium Green fluorescence images at the top of each plot) showing the relative increase in Calcium Green-dextran fluorescence in a rhizoid cell in response to transfer from 100% SW to 50% (B; n = 26) or 90% (C; n = 7) SW. Arrow indicates onset of osmotic treatment; a = cell apex; n = nuclear region. Confocal sections indicated were compiled sequentially to produce the pseudocolor temporal plots below each image.

