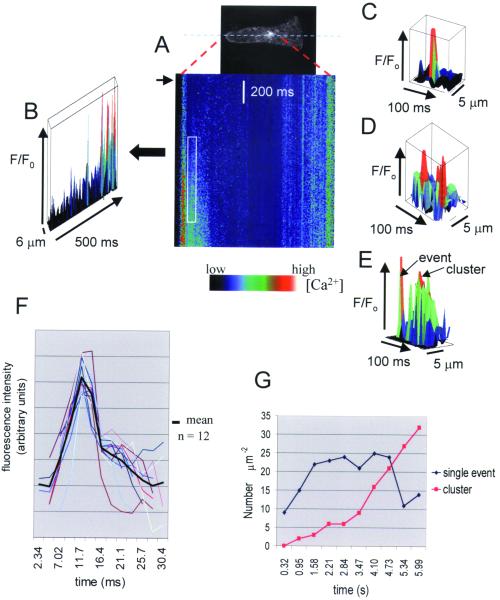
Figure 2.
Elemental Ca2+ elevations during Ca2+ wave propagation in a rhizoid cell. (A) Single-line confocal scans of Calcium Green fluorescence along the longitudinal axis of the cell during the initiation of Ca2+ waves are displayed sequentially to show the relative change in fluorescence following hypo-osmotic treatment [to 50% SW (arrow); n = 25.] The three-dimensional plot in B shows a nonuniform increase in Ca2+ during the onset of the Ca2+ wave in the rhizoid apex. In this plot, time increases from left to right whereas in the line-scan image (A), time increases from top to bottom. Elemental Ca2+ elevations in perinuclear regions (C) were frequently observed to arise repetitively at the same location (D). Events either occurred individually or appeared to cluster into more prolonged elevations (E). The data in A–E represent pixel values at least two SD of the background of a quiescent adjacent area (50 × 25 pixels). (F) Temporal profiles (colored plots) and averaged plot through elemental Ca2+ elevations show a rapid increase followed by a more gradual decline (n = 12). (G) The number of discrete elevations with values > 2 SD of the adjacent background at the rhizoid apex monitored over 630-ms time intervals increased initially during the first 1.5 s of wave propagation and then declined with the appearance of more prolonged elevations.

