Figure 3.
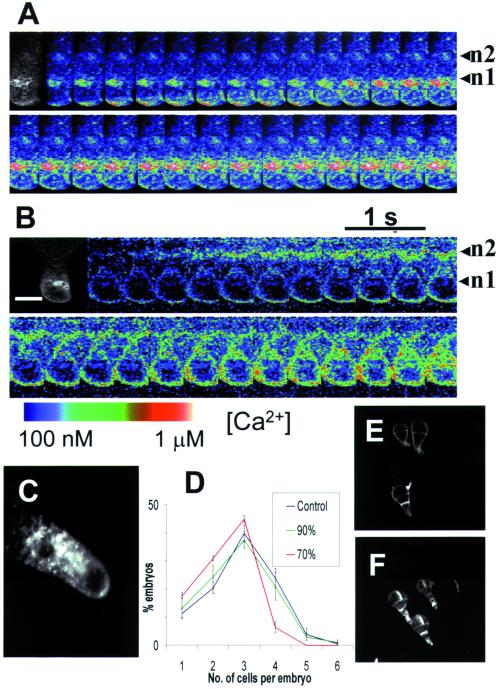
Patterns of Ca2+ elevation following hypo-osmotic treatment in dividing cells. (A) Calcium Green to Texas Red ratio images during the onset of a hypo-osmotically induced Ca2+ wave (100% SW to 50% SW) shows an initial elevation of Ca2+ in the rhizoid apex which declines before the onset of Ca2+ elevation arising in the apical nucleus region (n = 40). (B) A variation in this pattern was evident in a minority of cells where Ca2+ elevations were observed to arise in subapical nucleus simultaneous with the apical Ca2+ elevation (n = 10). (C) Confocal sections of ER stained with 1.0 μM DiOC6 (Molecular Probes) for 10 min show ER distributed in the rhizoid apex and perinuclear regions. (D) The number of cell divisions was significantly reduced following more severe hypo-osmotic shocks (e.g., 100% SW to 70% SW) that cause elevated nuclear Ca2+. (E and F) Polarized rhizoid growth was unaffected by hypo-osmotic treatments up to 50% SW (E) compared with control untreated embryos (F). (Bar = 15 μm.)

