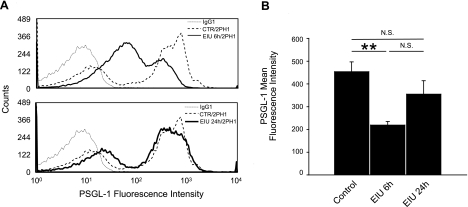
Figure 3.
PSGL-1 expression on PBLs during EIU. A) Representative histograms of PSGL-1 expression on PBLs from control (CTR) or EIU mice at 6 and 24 h after LPS injection. Leukocytes were stained with anti-PSGL-1 (2PH1) or IgG1 control antibodies conjugated with PE. PBLs from EIU animals 6 h after LPS injection showed decreased PSGL-1 mean fluorescence intensity values compared with normal controls. In contrast, leukocytes from EIU animals at 24 h after LPS injection showed PSGL-1 mean fluorescence values similar to control animals. Each curve is representative of 4 independent experiments. B) Quantification of PSGL-1 mean fluorescence intensity in control and EIU animals at 6 and 24 h after LPS injection. N.S., not significant. **P < 0.01.

