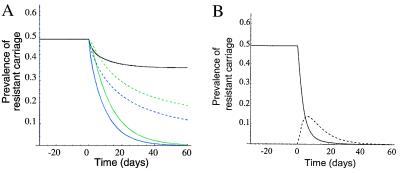
Figure 3.
The prevalence of carriage of bacteria resistant to drug 1 changes rapidly over the weeks after changes in hospital practice (at day 0), starting from an equilibrium where only drug 1 was being used. Parameters: μ = 1/(10 days), γ = 1/(30 days), m = 0.75, c = 0. Before day 0: β = 1/day, τ 1 = 1/(5 days), τ2 = 0. (A) Effects of reducing transmission rates (β) by 30% (black curve), reducing the use of drug 1 (τ1) (green curves) by 50% (dashed) or 100% (solid), or replacing 50% (dashed) or 100% (solid) of use of drug 1 by use of drug 2 (blue curves). Addition of drug 2 makes the decline in resistance to drug 1 faster and larger than reduction of drug 1 alone. (B) Carriage of resistance to drug 1 after a switch from use of drug 1 only to use of drug 2 only (same as solid blue curve), in individuals who have (dashed curve) and have not (solid curve) received drug 2. After about 7 days, drug 2 treatment becomes a risk factor for drug 1 resistance, even though use of drug 2 is aiding in the reduction of resistance to drug 1 in the hospital.

