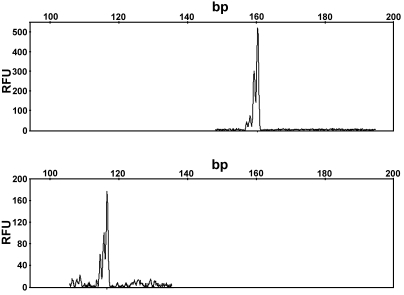
Figure 3.
Representative data output for analysis of LEW/SsNHsd DNA with markers D2Rat3 and D3Rat53. The 2 markers were amplified in a single PCR reaction and separated by capillary electrophoresis. The upper panel depicts the alleles for D3Rat53, and the lower panel depicts the alleles for D2Rat3. The alleles are represented by the peaks. The sizes in basepairs (bp) are indicated on the top x axis, such that smaller alleles appear to the left, and larger alleles appear to the right. The values on the y axis indicate fluorescent signal intensity given in relative fluorescent units (RFU) and vary for each sample. In this example, both primer sets were labeled with the same fluorescent dye (6FAM), but amplicons are readily distinguished due to the differences in the allele sizes: 162 bp for D3Rat53 and 121 bp for D2Rat3. As expected, this inbred strain is homozygous for the alleles depicted.

