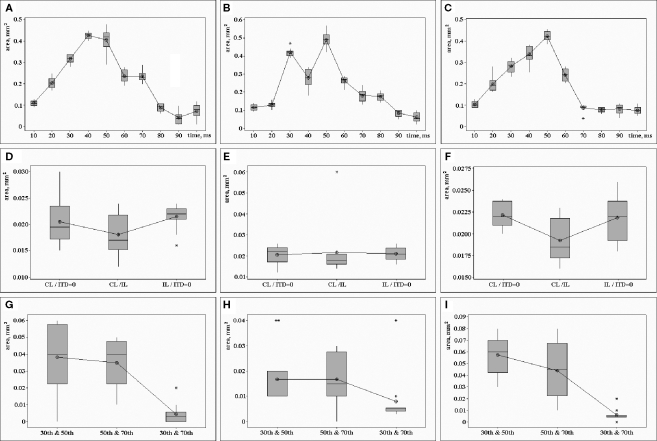
Figure 5.
The area where the voltage-sensitive dye signal exceeds 50% of the maximum response within the area of recording. Top row: (A) contralateral click led (CL), (B) simultaneous contra- and ipsilateral clicks (ITD = 0), (C) ipsilateral click led (IL). Period of time from the sound stimulus onset (millisecond) is shown along the horizontal axis, size of the activated area (square millimeter) is shown along the vertical axis. Middle row: the size of the activated area subject to various pairs of clicks and the period of time after stimulus onset. Three types of pairs are shown along the horizontal axis: CL/ITD = 0 – contralateral click leaded (CL) and both clicks presented simultaneously (ITD = 0), CL/IL – contralateral click leaded (CL) and ipsilateral click leaded (L-100-R), IL/ITD = 0 – ipsilateral click leaded (IL) and both clicks presented simultaneously (ITD = 0). Three periods of time after stimuli onset: (D) 30 ms, (E) 50 ms, (F) 70 ms. The size of the superimposition of the cortical areas is shown along the vertical axis (square millimeter). Bottom row: the common area (size is shown along the vertical axis, mm) of the cortical parts, activated at the 30th and 50th, or 50th and 70th, or 30th and 70th ms after stimulus onset: (G) ipsilateral click led stimuli (IL), (H) both clicks presented simultaneously (ITD = 0), (I) contralateral click led stimuli (CL). Standard deviation for n = 12 is shown along the vertical axis in all frames.

