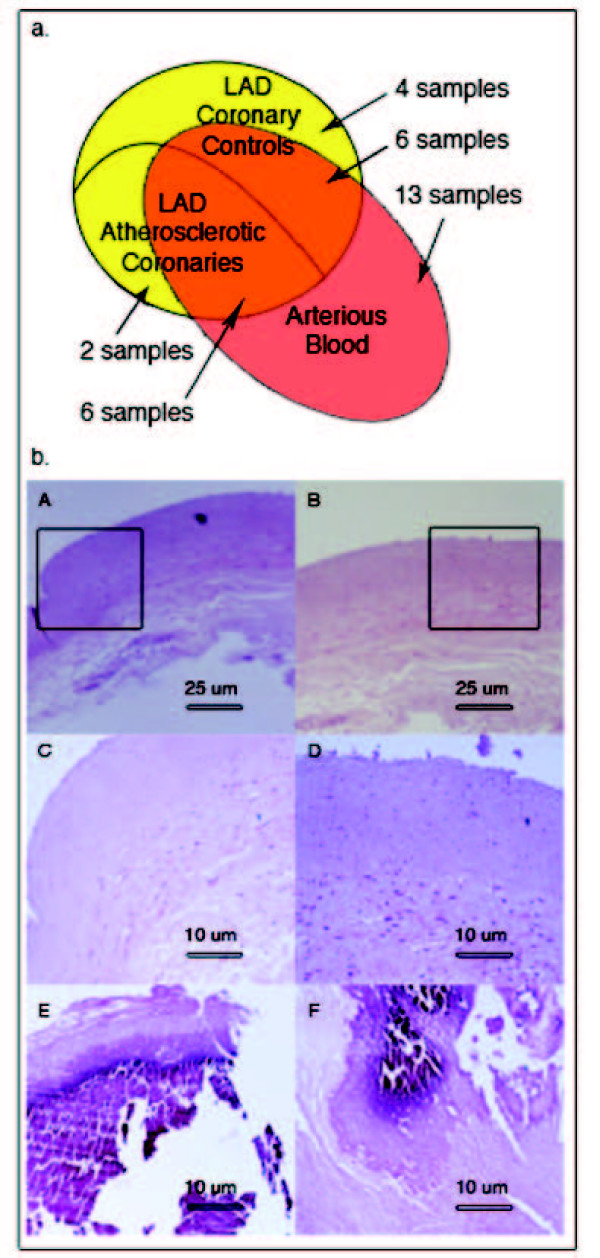
Figure 1.
a) Venn diagram representing the use of biological samples obtained from the cohort of patients recruited in our study. Yellow indicates LAD coronary samples used for gene expression profiling and red indicates arterial blood samples subjected to blood cytokine analysis. Intersection between red and yellow areas defines patients from whom coronary and blood samples have been subjected to the respective analyses. b) Histological cross-sections of two control (A, B, and C, D enlargements) and two patient (E, F) coronary samples. A and B images show normal coronary walls while E and F, representative for all analyzed patients, evidence calcified plaque.

