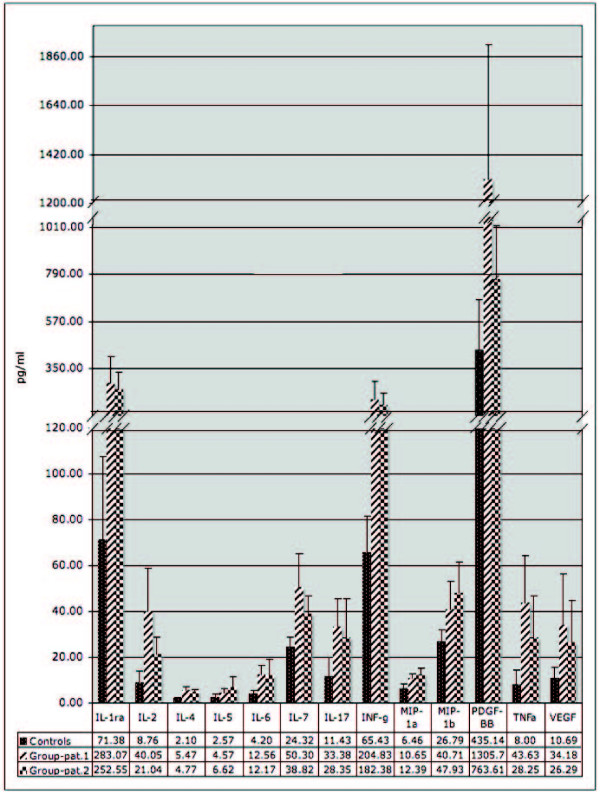
Figure 2.
Concentration of cytokines, chemokines and GFs differentially (p ≤ 0.05) expressed in arterial blood of patients. Baseline indicates mean values concentration across patients or controls for each protein. RANTES concentration is not shown, since measured values in patient plasma were saturating the BioPlex instrument.

