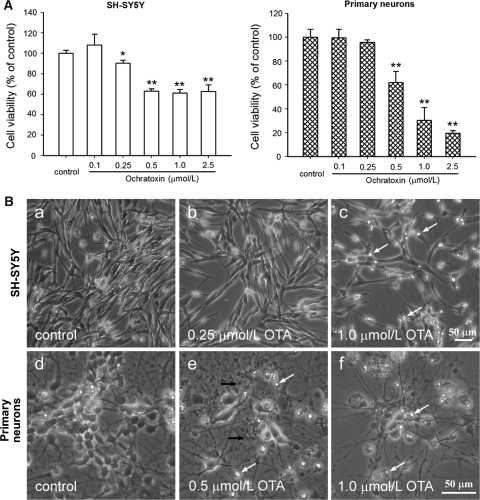
Fig. 2.
Viability and morphology of SH-SY5Y cells and primary neurons after 24 h incubation with OTA. A Cells were treated with various concentrations of OTA (0.1–2.5 μmol/L) and cell viability was determined by the neutral red assay. Data are expressed as mean with SD (n = 3). *P < 0.05; **P < 0.01 versus control. B Microphotography was performed after OTA incubation. a Vehicle control, b 0.25 μmol/L OTA, and c 1.0 μmol/L OTA in SH-SY5Y cells; d vehicle control, e 0.5 μmol/L OTA and f 1.0 μmol/L OTA in primary neurons. White arrows indicate insulted and detached cells, black arrows indicate tubercles in neuritis (Bar = 50 μm)

