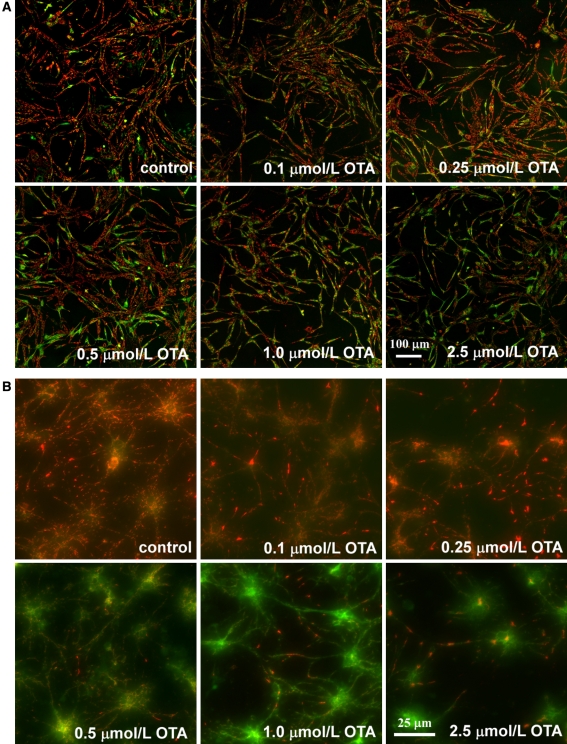
Fig. 4.
Mitochondria membrane potential ΔΨm assessment of SH-SY5Y cells (A) and primary neurons (B) after 8 h OTA treatment by JC-1 staining. Changes in mitochondria membrane potential ΔΨm are indicated by changes in the red to green fluroscence ratio (In SH-SY5Y cells, bar = 100 μm; in primary neurons, bar = 25 μm)

