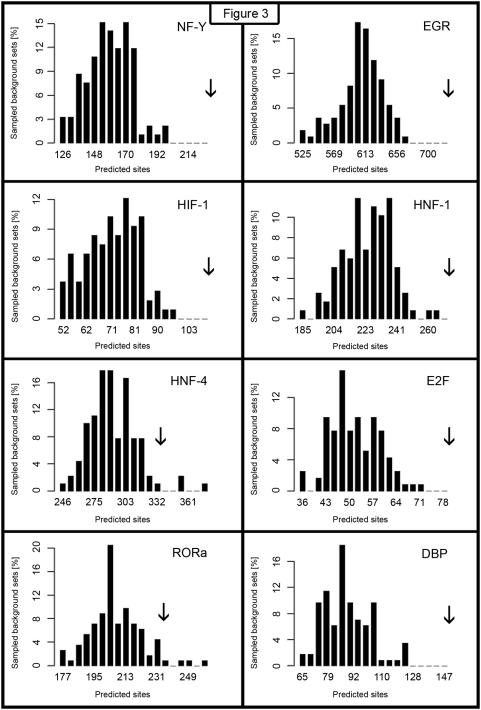
Figure 3. Distribution of the number of predicted TFBS.
The histograms illustrate the distributions of number of predicted hits of several motifs in sampled background promoter sets with a GC-content matched to the selected subset of 167 CCGs. X-axis indicates numbers of predicted sites, the height of vertical bars corresponds to the percentage of sampled background sets containing the given number of predictions. The number of hits in the foreground set of 167 CCGs is marked with an arrow. All shown motifs are overrepresented in the analyzed CCG set (have z-scores over 2). The corresponding z-score values are given in Tables 1 and 2.

