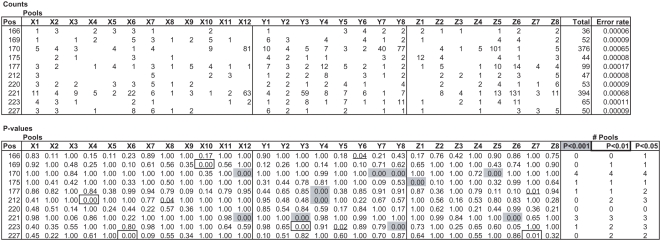
Figure 3. Results KeyPoint analysis mutant population.
The top panel shows numbers of G to A (position 221) and C to T (position 170) sequence deviations compared to the wild type sequence observed in each of the 3D pools in a subset of nucleotide positions of the SleIF4E amplicon 1. The total number of observed sequence deviations and calculated average error rates are shown at the right hand side. The bottom panel shows corresponding P values of false positives for each X, Y and Z pool. Total numbers of pools surpassing significance thresholds P<0.001, P<0.01 and P<0.05 are shown at the bottom right. The complete analysis of all nucleotide positions are shown in figure S4.

