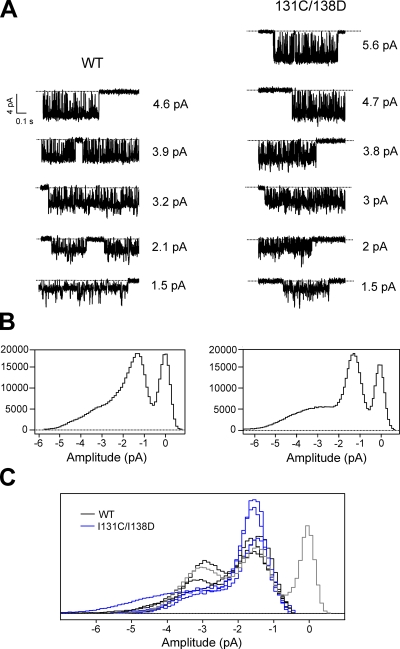
Figure 6.
Single-channel openings of KirBac1.1 show multiple conductance levels. (A) The currents shown are representative single-channel openings at −100 mV at all amplitude levels from a patch of WT and I131C/I138D. (B) All-points histograms of all channel openings from each recording. (C) A compilation of all-points histograms of channel openings from WT (n = 4; black) and I131C/I138D (n = 3; blue) recordings. The baseline (zero-channel current) peak is included for one histogram only (gray), and each histogram is scaled, for the sake of comparison, by dividing the bin values by the total number of points in each respective histogram.

