Figure 7.
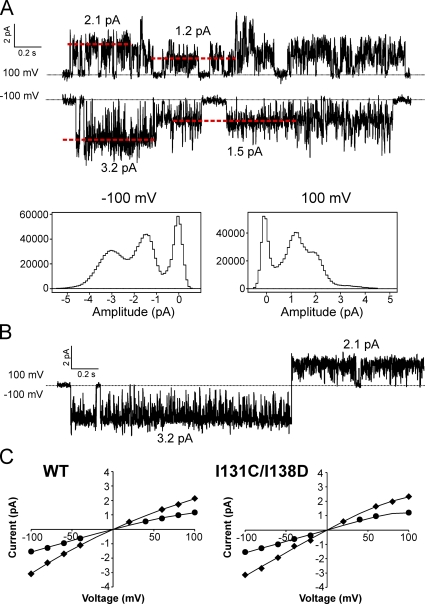
Single-channel amplitudes of KirBac1.1 show two predominant conductance levels and inward rectification. (A) Representative traces from a WT single-channel recording at +100 and −100 mV. The red dashed lines indicate the current amplitudes of the single-channel openings and correspond with the peaks in the histograms. Below are all-points histograms of all channel openings from the entire recording. (B) Single-channel opening from the same recording as in A showing the current amplitude of a single opening/conductance state at −100 and +100 mV. (C) Averaged I-V plots of single-channel amplitudes for WT and I131C/I138D (n = 4 ± SEM; the error bars are too small to be seen). The data points show only the two most prevalent conductance states (for WT, 15 and 32 pS at −100 mV, 12 and 22 pS at +100 mV). The solid lines have no theoretical meaning.

