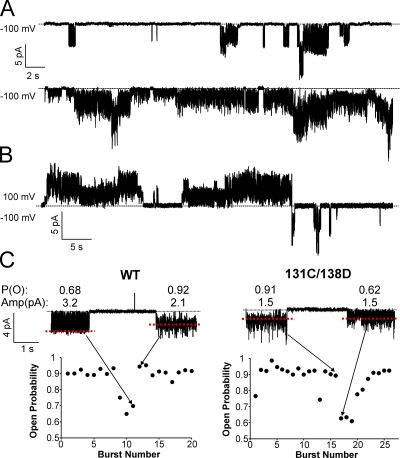
Figure 8.
Single-channel recordings show significant gating heterogeneity. (A) Two continuous recordings of WT single channels at −100 mV showing low open probability (top) and high open probability (bottom) currents. (B) A continuous recording of WT single channels at the indicated voltages. (C) Plots of intraburst open probability for every channel burst in a patch of WT and I131C/I138D. The currents above show two bursts at −100 mV with contrasting open probabilities that correspond to the data points indicated by the arrows. Open probability and current amplitude are shown above each burst.

