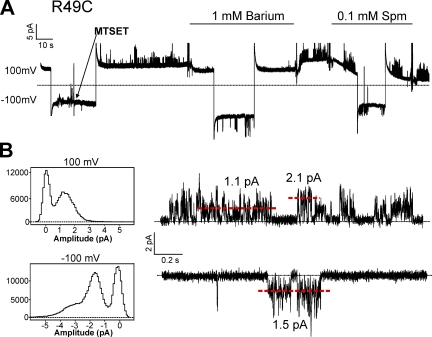
Figure 9.
Continuous recording of R49C held at +100 and −100 mV. 0.1 mM MTSET solution was applied as shown by the arrow, and solution changes were made at the indicated bars. Below are all-points histograms of the recording above with representative traces at +100 and −100 mV. The red dashed lines indicate current amplitudes that correspond with peaks in the histograms.

