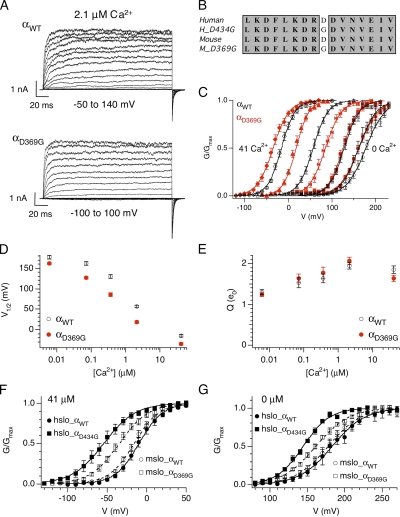
Figure 1.
D369G shifts mslo steady-state G-V relation to hyperpolarizing membrane potentials. (A) A family of currents from wild-type (top) or D369G mutant (bottom) BK channels composed of only the pore forming α subunits. Recorded in 2.1 μM Ca2+, currents were evoked in response to 200-ms depolarizations at the indicated membrane potentials. (B) Alignment of amino acid sequence flanking the lysine (D) to glycine (G) epilepsy mutation. (C) Mean G-V relations at different Ca2+ for αWT and αD369G. Each point represents mean data from 5 to 26 experiments. Solid curves represent fits to the Boltzmann function. (D) Mean V1/2 and (E) mean effective gating charge (Q) values plotted as a function of Ca2+. Error bars represent SEM. (F) D434G shifts G-V to more negative membrane potentials at 41 µM Ca2+ compared to D369G (hslo_αWT: n = 9; hslo_αD434G: n = 10; mslo_αWT: n = 19; mslo_αD369G: n = 18). (G) D434G shifts G-V to more negative membrane potentials at nominal Ca2+ compared to D369G (hslo_αWT: n = 5; hslo_αD434G: n = 5; mslo_αWT: n = 12; mslo_αD369G: n = 14). Symbols represent mean G/Gmax data, curves represent fits to the Boltzmann function, and error bars represent SEM.

