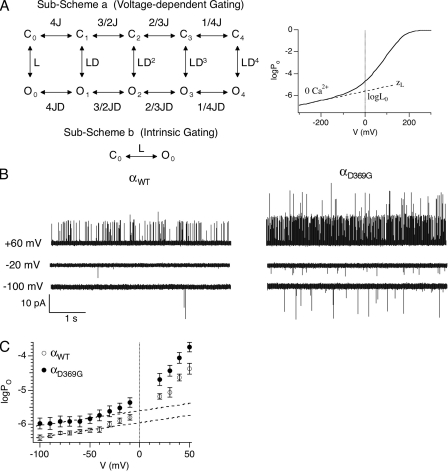
Figure 2.
D369G decreases the energetic barrier for channel to open. (A; left) According to the dual-allosteric mechanism (Horrigan et al., 1999; Horrigan and Aldrich, 2002), BK channel transitions between closed (C) and open (O) conformation is allosterically regulated by the state of four independent and identical voltage sensors. Sub-Scheme a represents BK channel’s gating scheme at 0 Ca2+. The channel resides in either the open or closed conformation, with 0–4 voltage sensors in the activated state. The equilibrium between C-O transitions is allosterically regulated by the states of the voltage sensors. Sub-Scheme b represents BK channel’s gating scheme at 0 Ca2+ and very negative voltages. With all voltage sensors in the resting state, the channel resides in one of two conformations, C0 and O0. The equilibrium between the C0-O0 transition is described by L, the intrinsic equilibrium for channel opening in the absence of Ca2+ and voltage sensor activation. (Right) This illustrates how two components of L (L0 and zL) can be estimated by logPo-V data at 0 Ca2+ and negative voltages. The curve represents simulated logPo versus voltage curve in nominally 0 Ca2+. The gating parameters used for simulation are as follows: L0 = 2.5 × 10⁻⁶, zL = 0.25 e0, zJ = 0.54e0, VhC = 173 mV, and VhO = 25 mV. Dashed line represents fit for logPo-V at limiting slope using Eq. 4. L0 and zL can be derived from the fit (Horrigan and Aldrich, 2002). (B) Single-channel BK currents recorded in nominally 0 [Ca2+] at the indicated voltages. αWT and αD369G data were obtained from patches containing estimated 64 and 317 channels, respectively. All traces were filtered at 5 kHz. (C) D369G increases L0. Mean logPo plotted as a function of voltage in nominally 0 Ca2+ (αWT: n = 5–13; αD369G: n = 6–11). Error bars represent SEM. L0 was estimated by linear fits (dashed lines) of logPo-V relations between −100 to −50 mV using Eq. 1. zL value was set as 0.25 e0.

