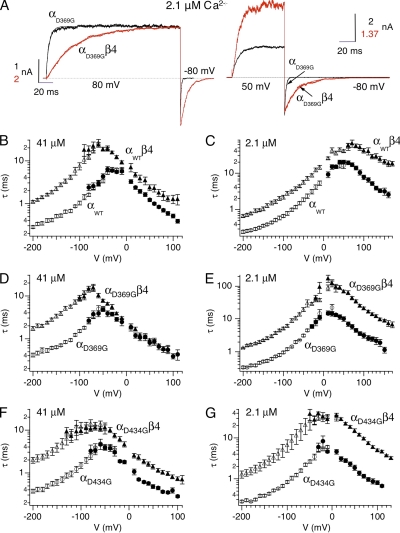
Figure 6.
Effects of β4 on D369G BK channel gating kinetics. (A; left) Compare activation kinetics. αD369G and αD369Gβ4 currents at 2.1 µM Ca2+. Patches were held at −80 mV and stepped to +80 mV for 200 ms. Superimposed on the current traces are the single-exponential fits to the activation time courses (αD369G: τ = 4.7 ms; αD369Gβ4: τ = 40.3 ms). (Right) Compare deactivation kinetics. αD369G and αD369Gβ4 currents at 2.1 µM Ca2+. Channels were activated at +50 mV before membrane was stepped to −80 mV for 100 ms. Superimposed on the current traces are the single-exponential fits to the deactivation time courses (αD369G: τ = 1.1ms; αD369Gβ4: τ = 11.7 ms). (B) Comparison of αWT and αWTβ4 channel kinetics at 41 µM Ca2+ (αWT activation: n = 8–26; αWT deactivation: n = 12; αWTβ4 activation: n = 13–35; αWTβ4 deactivation: n = 16–21). (C) Comparison of αWT and αWTβ4 channel kinetics at 2.1 µM Ca2+ (αWT activation: n = 17; αWT deactivation: n = 6–30; αWTβ4 activation: n = 7–22; αWTβ4 deactivation: n = 11–12). (D) Comparison of αD369G and αD369Gβ4 channel kinetics at 41 µM Ca2+ (αD369G activation: n = 5–18; αD369G deactivation: n = 13–14; αD369Gβ4 activation: n = 5–16; αD369Gβ4 deactivation: n = 13). (E) Comparison of αD369G and αD369Gβ4 channel kinetics at 2.1 µM Ca2+ (αD369G activation: n = 5–23; αD369G deactivation: n = 13–19; αD369Gβ4 activation: n = 6–34; αD369Gβ4 deactivation: n = 8–20). (F) Comparison of αD434G and αD434Gβ4 channel kinetics at 41 µM Ca2+ (αD434G activation: n = 11; αD434G deactivation: n = 7; αD434Gβ4 activation: n = 11; αD434Gβ4 deactivation: n = 10). (G) Comparison of αD434G and αD434Gβ4 channel kinetics at 2.1 µM Ca2+ (αD434G activation: n = 7; αD434G deactivation: n = 5; αD434Gβ4 activation: n = 9; αD434Gβ4 deactivation: n = 9). Filled symbols represent measurements obtained from tail currents (deactivation time constant), and empty symbols represent measurements obtained from activation time constant.

