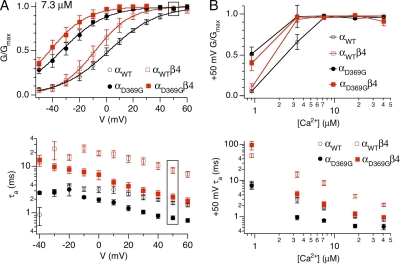
Figure 8.
Ca2+-dependent effects of the mutation on BK channel gating in “physiological” solutions. (A; top) Average G-V relationship at 7.3 µM Ca2+ (αWT: n = 18; αWTβ4: n = 10; αD369G: n = 8; αD369Gβ4: n = 10). (Bottom) Average activation time constants at 7.3 µM Ca2+ (αWT: n = 15; αWTβ4: n = 10; αD369G: n = 8; αD369Gβ4: n = 9). Boxed regions indicate values at +50 mV. (B; top) G/Gmax versus Ca2+ concentration at +50 mV. (Bottom) Average activation time constants at +50 mV as a function of Ca2+ concentration.

