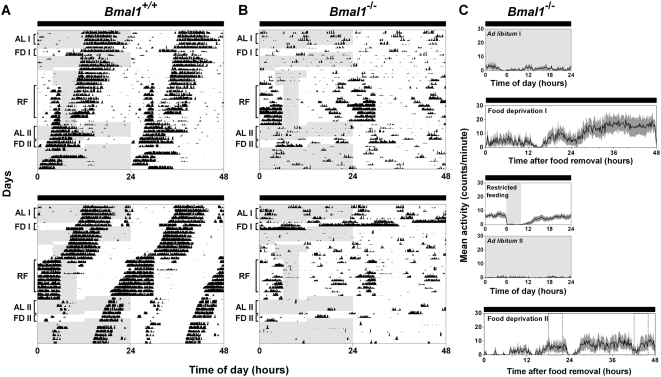
Figure 5. BMAL1-deficient mice display robust wheel-running activity prior to food availability in constant darkness (DD).
Representative double-plotted actograms of wheel-running activity of Bmal1 +/+ (A; n = 6) and Bmal1 −/− (B; n = 8) mice in DD. Group mean activity profiles for Bmal1 −/− mice (C) were generated by averaging the number of wheel revolutions per 10-minute bin (black line) and were plotted relative to local time (where time 0 was the time of lights on and time 12 was lights off in the light-dark cycle prior to releasing the mice into DD). The SEM, which represents the variability among mice, is shown in dark gray shading. The time when food was available is indicated by light gray shading in the activity profiles and on the left half of each actogram. AL I, FD I, RF, AL II, and FD II labels of the actograms (B) indicate the days used to generate the activity profiles ad libitum I, food deprivation I, restricted feeding, ad libitum II, and food deprivation II, respectively (C).

