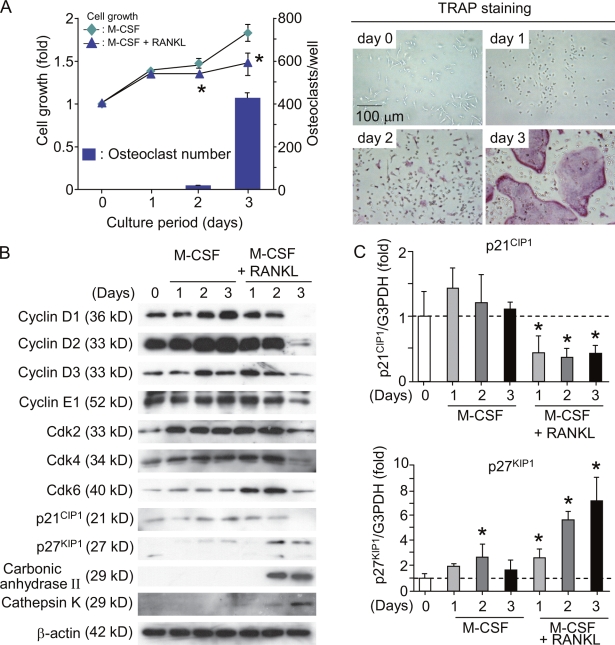
Figure 1.
Regulation of cell cycle during differentiation of BMMΦ into osteoclasts. (A) Time course of changes in cell growth and TRAP+ osteoclast formation in BMMΦ cultures. Bone marrow cells were cultured with 104 U/ml M-CSF for 4 d to prepare BMMΦ. BMMΦ were further cultured with or without 100 ng/ml RANKL in the presence of 104 U/ml M-CSF. After culturing for the indicated periods, cell growth was measured by the AlamarBlue assay (Invitrogen) and expressed as the increase in fluorescence emission at 590 nm (excitation wavelength, 560 nm) relative to the control at day 0 (left). In the other culture treated with RANKL and M-CSF, cells were fixed and stained for TRAP (right). TRAP+ multinucleated cells containing more than three nuclei were counted as osteoclasts (bars). Results are expressed as the mean ± SD for six cultures. *, P < 0.01; significantly different from the culture treated with M-CSF alone. (B) Expression of cell cycle regulatory molecules and osteoclast-specific molecules in BMMΦ cultured with M-CSF or M-CSF plus RANKL. BMMΦ were cultured with 104 U/ml M-CSF or 104 U/ml M-CSF plus RANKL (100 ng/ml). After the indicated periods, cell lysates were prepared and subjected to immunoblot analyses of the indicated cell cycle regulatory molecules. Cell lysates were also analyzed for osteoclast-specific markers such as carbonic anhydrase II and cathepsin K. (C) Real-time PCR analysis of expression of p21CIP1 and p27KIP1 mRNAs in BMMΦ. BMMΦ were cultured with 104 U/ml M-CSF or104 U/ml M-CSF plus100 ng/ml RANKL. After the indicated periods, total RNA was extracted from cells. Expression levels of p21CIP1 and p27KIP1 mRNAs were estimated by quantitative real-time RT-PCR. Dashed lines indicate control levels. Results are expressed as the relative expression of p21CIP1 and p27KIP1 mRNAs compared to the control at day 0. *, P < 0.05. Error bars indicate mean ± SD for three experiments.

