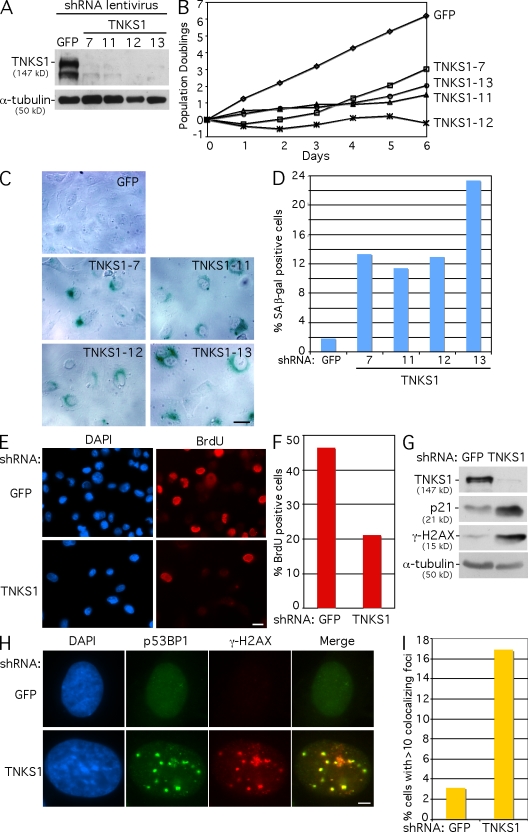
Figure 1.
Tankyrase 1 depletion leads to DNA damage and a senescence-like phenotype in HTC75 tumor cells. (A) Immunoblot analysis of extracts from HTC75 cells harvested 48 h after infection with GFP, TNKS1-7, TNKS1-11, TNKS1-12, or TNKS1-13 lentiviral shRNAs. (B) Graphical representation of the effect of tankyrase 1 depletion on HTC75 cell growth. Growth was monitored from 48 h after infection (day 0) to day 6. Cell growth was plotted as PDs versus days in culture. (C) Phase contrast microscopic images of HTC75 cells stained for SA β-galactosidase activity 48 h after infection with the indicated lentiviral shRNAs. (D) Quantification of SA β-galactosidase–positive cells. Approximately 500 cells were scored for each sample. (E) Immunofluorescence analysis of HTC75 cells infected with GFP or TNKS1 lentiviral shRNA. 48 h after infection, cells were incubated with BrdU for 1 h, ethanol fixed, and probed with anti-BrdU antibody (red); DNA was stained with DAPI (blue). (F) Quantification of BrdU-positive cells. Approximately 1,000 cells were scored for each sample. (G) Immunoblot analysis of extracts from HTC75 cells harvested 48 h after infection with GFP or TNKS1 lentiviral shRNA shows up-regulation of p21 expression and induction of γ-H2AX in tankyrase 1–depleted cells. (H) Immunofluorescence analysis of HTC75 cells infected with GFP or TNKS1 lentiviral shRNA, fixed with paraformaldehyde 48 h after infection, and stained with antibodies against p53BP1 (green) and γ-H2AX (red); DNA was stained with DAPI (blue). (I) Quantification of DNA damage foci. Cells with >10 foci that costained with 53BP1 and γ-H2AX were scored. Approximately 1,000 cells were scored for each sample. Bars: (C and E) 20 µm; (H) 5 µm.

