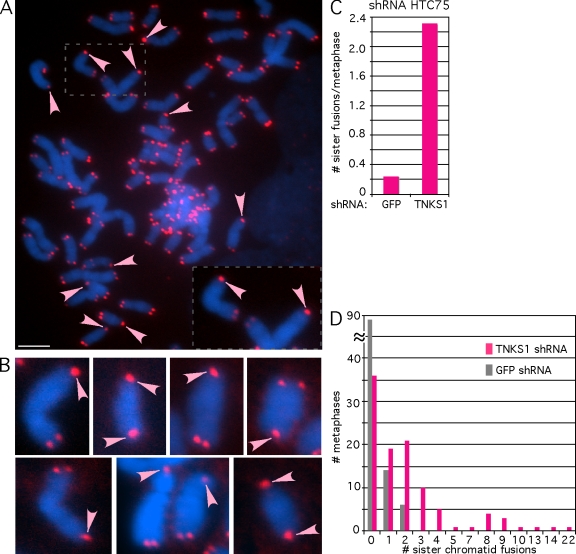
Figure 4.
Tankyrase 1 depletion leads to sister chromatid fusions in HTC75 cells. (A–D) Visualization and quantification of telomeric PNA FISH analysis of metaphase spreads of HTC75 cells after infection with GFP or TNKS1 lentiviral shRNA. At 48 h after infection, colcemid was added for 12 h, and cells were collected by trypsinization, swollen in hypotonic buffer, and fixed in methanol/acetic acid. Telomere repeats were detected by using a Cy3-(CCCTAA)3 PNA probe (red). DNA is stained with DAPI (blue). (A) A metaphase spread from TNKS1 lentiviral shRNA–infected HTC75 cells showing multiple sister chromatid fusions (indicated with arrowheads). The inset is an enlargement of two chromosomes. (B) Examples of sister chromatid fusions (arrowheads) taken from different metaphase spreads from TNKS1 lentiviral shRNA–infected HTC75 cells. Note that in some cases, sister chromatid fusions were present at both ends of the chromosome. (C) Quantification of the frequency of sister chromatid fusions per metaphase in HTC75 cells. (D) Graph showing the distribution of the number of sister chromatid fusions observed in each metaphase. 104 metaphase spreads from two independent experiments were analyzed (Table I, experiments 1 and 2). Bar, 5 µm.

