Figure 1.
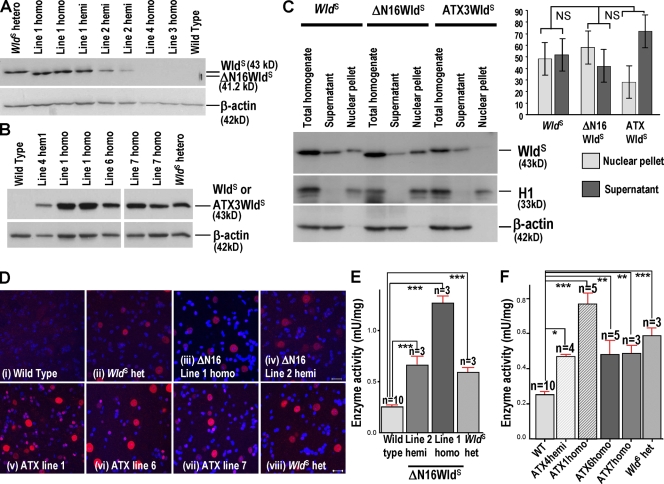
Overexpression of ΔN16WldS and ATX3WldS in Tg mice. (A and B) Western blots of ΔN16WldS and ATX3WldS brains probed with Wld18. ΔN16WldS lines 1 and 2 alone express a protein slightly smaller than WldS. The 43-kD ATX3WldS band matches that in WldS. (C) Brain Western blots of total homogenate and nuclear and cytoplasmic fractions of WldS, ΔN16WldS (line 1), and ATX3WldS (line 6). The graph shows integrated band intensities of nuclear and cytoplasmic fractions normalized to H1 and β-actin, respectively. These normalized figures were then expressed as a percentage of the total homogenate signal and normalized to the same respective markers (mean ± SD; n = 3). Statistical analysis was performed on the nuclear versus supernatant ratio using a Mann-Whitney test followed by a Bonferroni post-hoc test. (D) Immunofluorescence of lumbar spinal cord sections with Wld18 (red) and DAPI. Motor and interneuron nuclear signals in Tg ΔN16WldS (i–iv) and ATX3WldS (v–viii) show similar strength and distribution as WldS heterozygotes. Identical laser intensities and camera settings were used for each image. (E and F) Transgene products are enzymatically active. Nmnat activity is very significantly increased compared with wild-type (WT) brains in hemizygotes and homozygotes of all expressing Tg lines as well as WldS heterozygotes. Mean ± SD; *, P < 0.05; **, P < 0.01; ***, P < 0.001. Bars, 10 µm.

