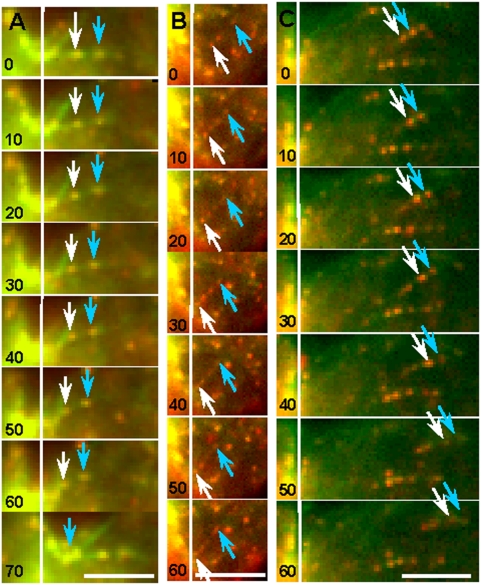
Figure 6. Tracking individual actin filaments labeled by Alexa 488-Phalloidin and speckled with Qdot 655-Phalloidin.
As shown in the kymographs (Videos S8, S9, S10), actin filaments could be seen moving into the cleavage furrow (A, B) and moving away from the furrow (C). Arrows depict Qdot-marked reference points on the actin filaments, and a white vertical line marks the location of each cleavage furrow. Time in seconds. Bar, 10 µm.

