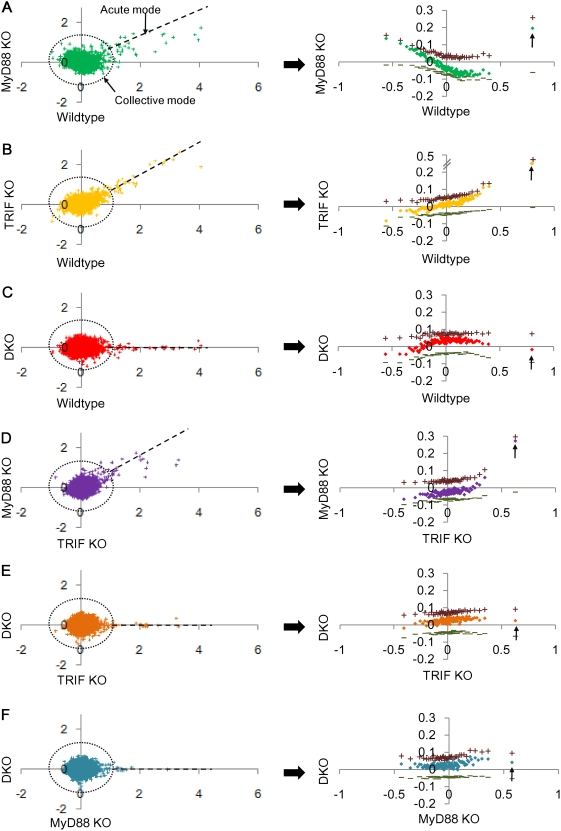
Figure 6. Large scatter in collective mode and linear distribution in acute-stochastic mode.
Genome-wide single ORFs (left panels) expression changes (Δx) for 0–1 h between genotypes: wildtype vs. A) MyD88 KO, B) TRIF KO, C) DKO; TRIF KO vs. D) MyD88 KO and E) DKO; F) MyD88 KO vs. DKO. Right panels: corresponding plots for group of 200 ORFs, sorted by their expression change in the corresponding genotype (x-axis). + and − indicate average of expression change of the upregulated and downregulated ORFs in each group, respectively. Arrows indicate groups containing the acute-stochastic mode.

