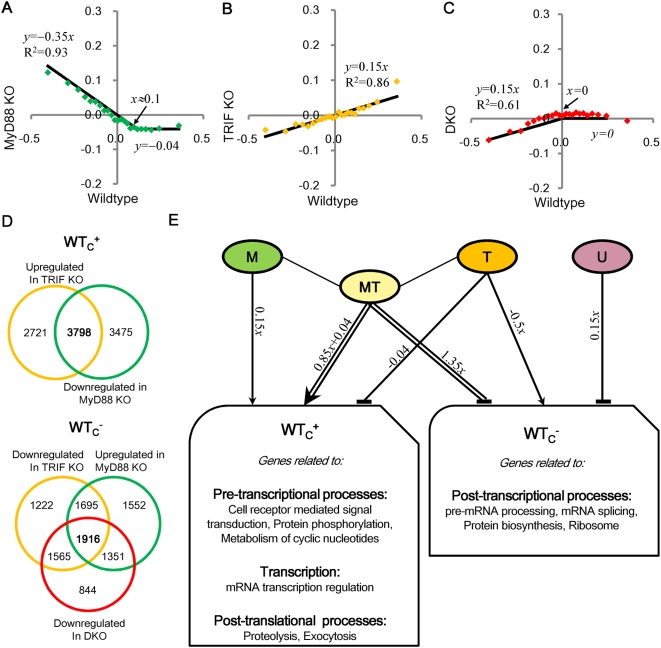
Figure 8. Deciphering gene regulatory mechanisms from the emergent signature.
Linear regressions of genome-wide expression changes (Δx) between genotypes after the removal of global shifts in Figure 7: A) wildtype vs. MyD88 KO, B) wildtype vs. TRIF KO, C) wildtype vs. DKO, for group of 1000 ORFs, sorted from highest to lowest expressions change in wildtype. Each point represents the average expression changes of 1000 ORFs (see Methods). Distributions are approximated to linear equations represented by y = αx+β (main text) so as to obtain best fit. Flat distributions are fitted to the average of their points (R 2 = 0). D) Gene clustering. The 3798 ORFs upregulated in TRIF KO and downregulated in MyD88 KO for WTc + (top panel) and the 1916 ORFs downregulated in TRIF KO and DKO, and upregulated in MyD88 KO for WTc − (bottom panel) were selected to determine biological processes regulated in whole genome (see maintext). E) Individual effects of M, T, MT and U on the biological processes regulated in collective mode of WTc +and WTc −. Arrows indicate activation through dominant transcription and T-shaped lines indicate repression through dominant mRNA decay.

