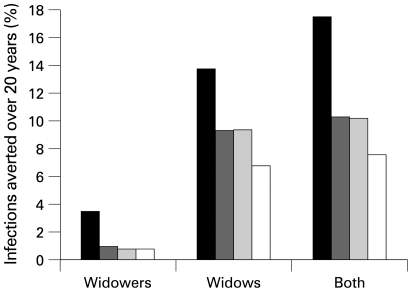
Figure 4.
Model prediction. Percentage of cases averted over 20 years after cessation in sexual behaviour of male, female and all widows. Four scenarios of the pre-intervention mixing and sexual activity patterns of widows (W) and non-widows (NW) are presented: (1) Widows form more sexual partners than non-widows, the age difference between partners is higher for widows than non-widows, and widows form most of their partnerships with non-widows (black bars). (2) As for (1), but with the same numbers of sexual partners (dark grey bars). (3) As for (2), but age difference between partners is the same (light grey bars). (4) As for (3), but widows preferentially form partnerships with other widows (white bars).

