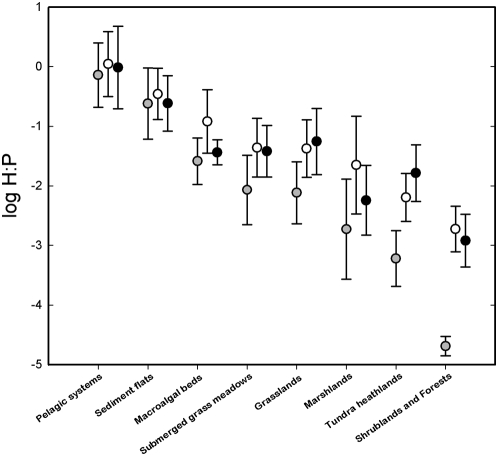
Figure 2. The ratio (mean±SD) of herbivore-to-producer biomass (H∶P, in g element m−2 ∶ g element m−2) in aquatic and terrestrial systems.
Gray, white and black circles correspond to carbon, nitrogen and phosphorus units, respectively. Ratios were analyzed with a two way ANOVA with element (carbon, nitrogen and phosphorus) and system type as the two factors after log-transformation to comply with the assumptions of ANOVA. Ratios varied among elements (P<0.001) and also among system types (P<0.001). Most importantly, the differences among elements depended on the system type considered (P<0.05 for the interaction between element and system type) indicating that, for terrestrial systems, ratios expressed in carbon units tended to be lower than ratios expressed in nitrogen or phosphorus units, but not for aquatic systems.

