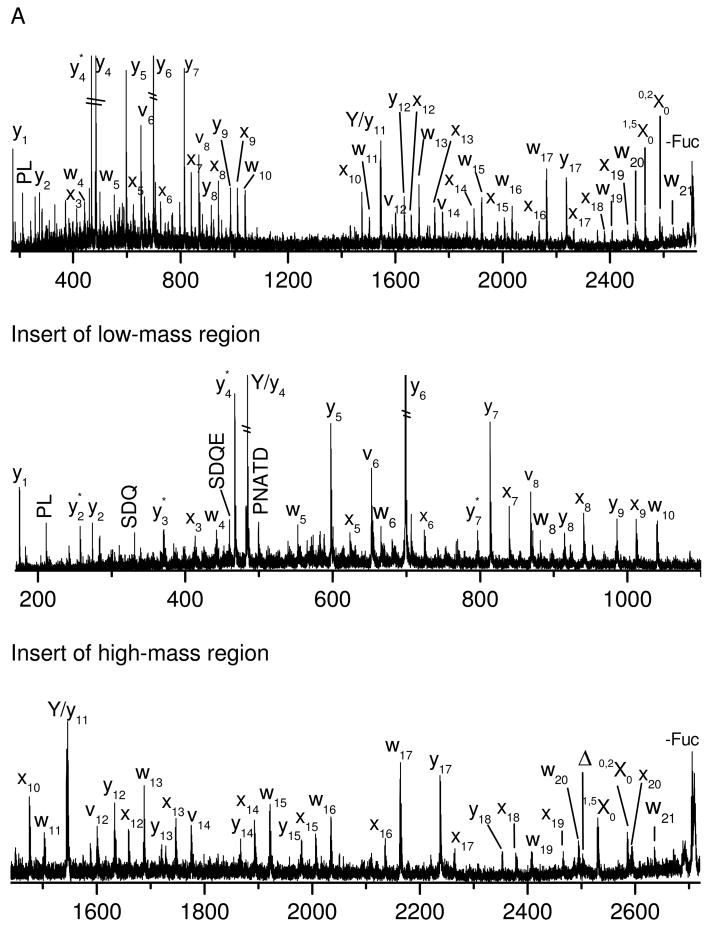
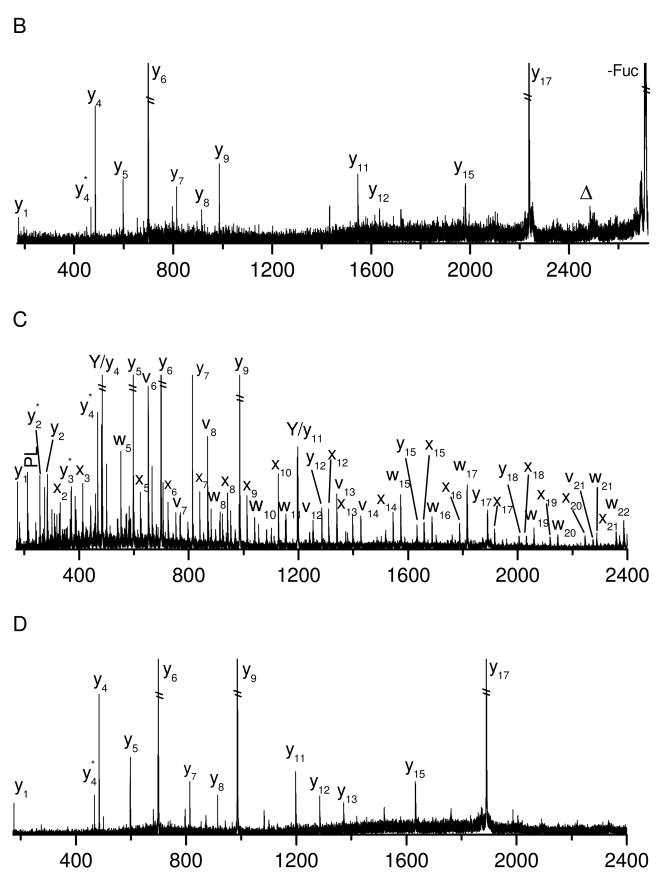
Figure 1.
(A) Photodissociation (B) PSD spectrua of singly-charged glycopeptide A obtained in the MALDI TOF-TOF mass spectrometer. (C) Photodissociation and (D) PSD spectra of glycopeptide A after deglycosylation. In all figures, peptide fragments are labeled with lower-case letters while glycan fragments are labeled with capital letters. Delta (Δ) denotes fragments corresponding to loss of the whole glycan via cleavage of the N-glycosidic bond or the amide bond on asparagine side chain. Asterisk (*) represents loss of ammonia.


