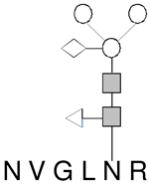
Table 1.
N-linked glycopeptides from horseradish peroxidase
| Name | Structure | Peptide Sequence | Glycan Mass (Da) |
|---|---|---|---|
| A |
|
272–294 | 367.15 |
| B |

|
272–294 | 1188.43 |
| C |

|
184–189 | 1188.43 |
| D |

|
295–313 | 1188.43 |
In all glycan structure drawings, the circle (○), solid square ( ), triangle (◁) and diamond (◇) represent mannose, N-acetylglucosamine, fucose and xlylose, respectively.
