
Figure 2. Orientation Dependence of L612M Pol δ Mutagenesis in the URA3 Target.
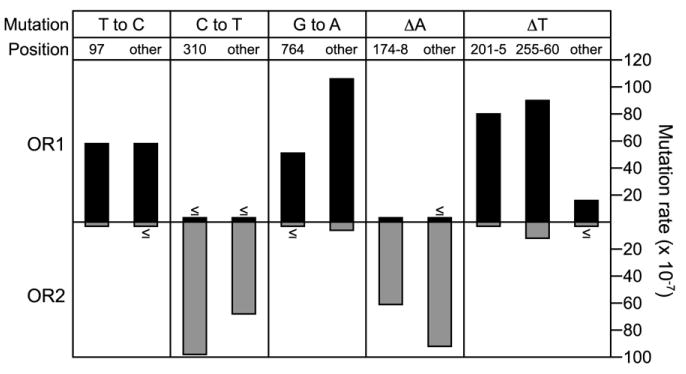
The mutation rate in orientation 1 (OR1, upward black bars) and orientation 2 (OR2, downward gray bars) for each type of error is shown for the hotspot locations (numerical values) and all other sites within the URA3 target (other). When an event was not observed, the upper limit of the mutation rate is shown, labeled with a ≤ symbol above (OR1) or below (OR2) the bar. See Table S1 for mutation rate values.