
Figure 3. Error Bias of L612M Pol δ at the Three URA3 Base Substitution Hotspots.
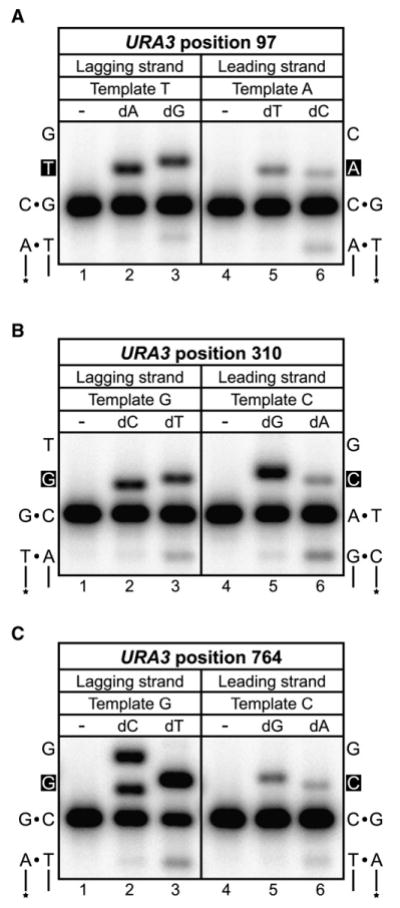
Mismatch insertion efficiency of L612M Pol δ was determined in vitro for lagging versus leading strand errors for the URA3 base substitution hotspots at positions (A) 97, (B) 310, and (C) 764. For each panel, the template sequences of the lagging and leading strands are shown on the left and right, respectively, with the site of insertion in white font on a black background. Lanes 1 and 4 of each panel are mock reactions lacking L612M Pol δ; lanes 2 and 5 contain the correct incoming nucleotide (100 μM, 1 min reaction); and lanes 3 and 6 contain the appropriate mismatched nucleotide (1 mM, 10 min reaction). See Table S2 for additional information.