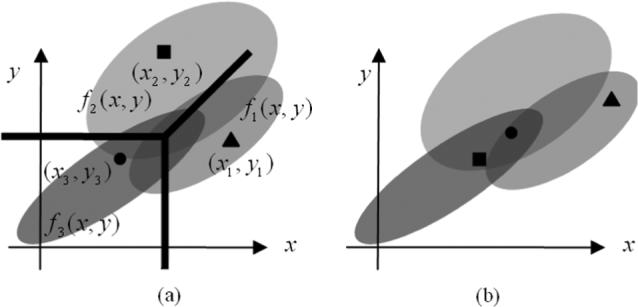
Fig. 2.

Illustration of a mathematical treatment of the categorization procedure that is equivalent to a rating procedure. Ellipses with different shadings schematically represent the distributions of decision variables for the three classes. Triangle is a random sample from class 1, the square is a random sample from class 2, and the disk represents a random sample from class 3. (a) Illustration of a case where the triplet can be correctly categorized. (b) Illustration of a case where correct categorization is not possible for any position of the proposed decision structure.
