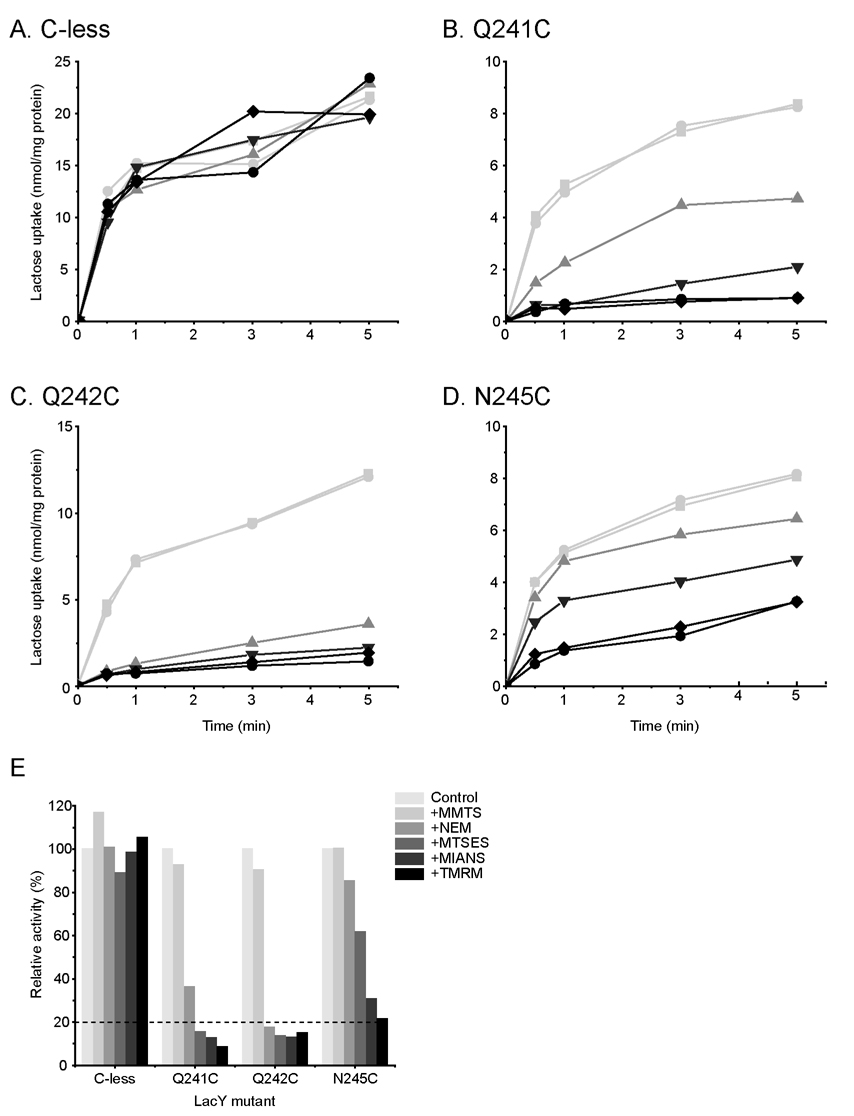
Figure 4.
Transport activity. MMTS-, NEM-, MTSES-, MIANS-, or TMRM-treated RSO membrane vesicles containing Cys-less LacY (A) or single-Cys mutants, Q241C (B), Q242C (C) or N245C (D) were subjected to lactose transport activity assay. (E) Histogram showing relative transport activity. The initial rate of lactose transport at 30 sec is plotted relative to the untreated control value (100%) of each mutant.  , Control;
  , +MMTS;
  , +NEM;
  , +MTSES;
  , +MIANS;
  , +TMRM. The experiments were performed as described in Materials and Methods.

