
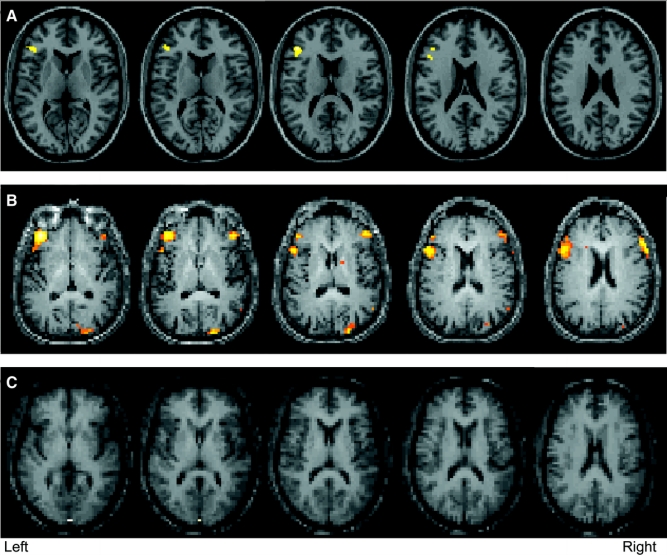
Figure 1 fMRI scan results for auditory description decision task
(A) Controls group map (p < 0.05 family-wise error, corrected) showing predominant left frontotemporal activation. (B) Affected subject V-2 (p < 0.05 family-wise error, corrected) showing bilateral (but not reduced) activation with right predominance, reversing the normal pattern. (C) Affected subject I-4 (p = 0.001 family-wise error, corrected) showing reduced activation.