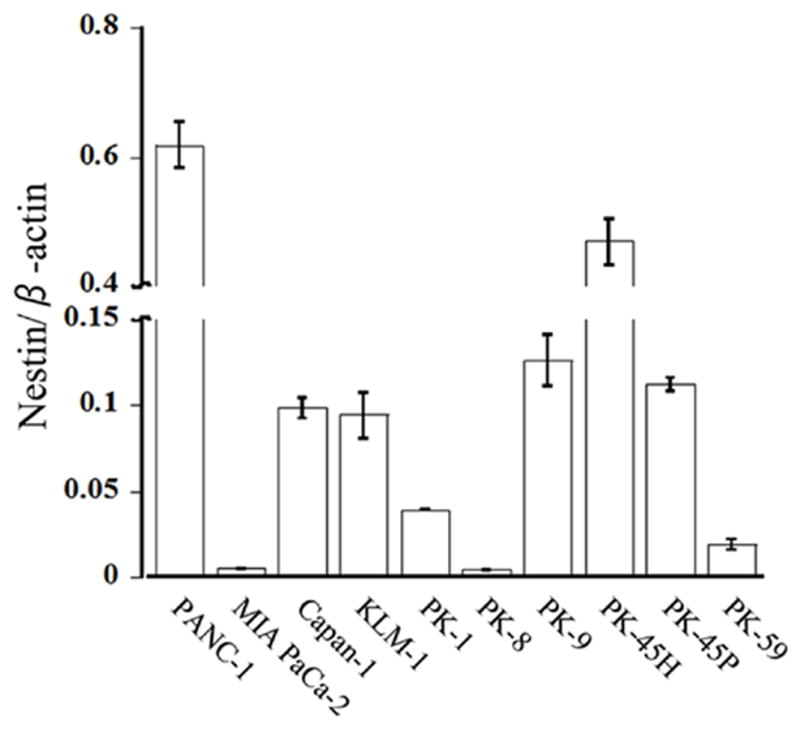
Figure 2. Quantitative RT-PCR analysis of Nestin mRNA levels.

Nestin mRNA levels were highest in PANC-1 cells, and lowest in PK-8 cells. In PANC-1 cells, Nestin mRNA levels were approximately 137-fold higher than in PK-8 cells.

Nestin mRNA levels were highest in PANC-1 cells, and lowest in PK-8 cells. In PANC-1 cells, Nestin mRNA levels were approximately 137-fold higher than in PK-8 cells.