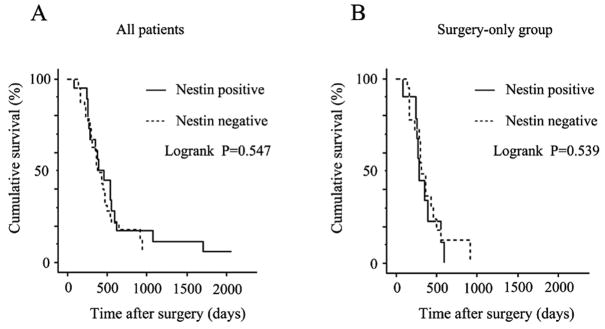
Figure 6. Cumulative Kaplan-Meier survival curves.
Cumulative survival plots of the post-operative survival periods are shown for all patients (A) and for patients who underwent tumor resection but did not receive adjuvant chemotherapy (B). The survival of patients with Nestin-positive or negative tumors was similar, irrespective of whether all the patients were evaluated (p=0.547, A) or the surgery-only group was evaluated (P=0.539, B).

