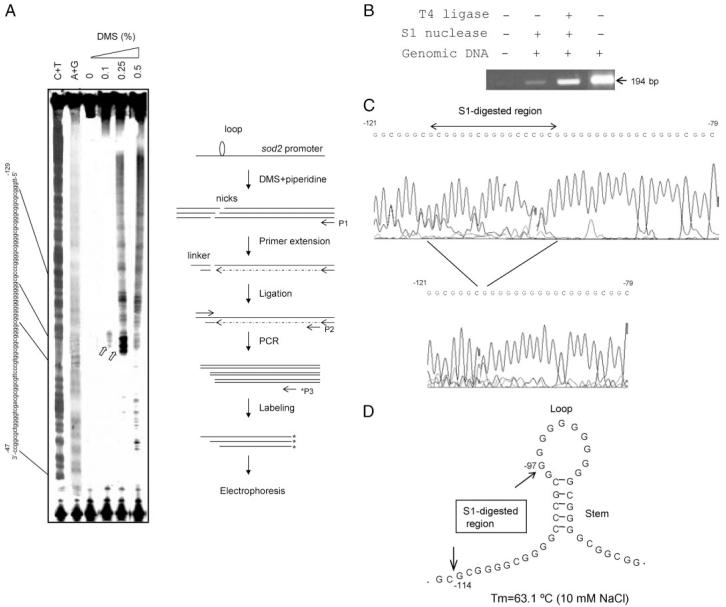
FIGURE 1. Determination of an 11G single-stranded loop structure in the human sod2 promoter region.
A, genomic DNA extracted from DMS-treated VA13 cells was cleaved by piperidine. Ligation-mediated PCR was used to screen the loop structure as illustrated at the right. As markers, genomic DNA extracted from DMS-untreated cells was chemically sequenced (C+T and A+G reactions). Sequence of the promoter region is labeled according to the results of chemical sequencing. Susceptibility of the 11G-loop to DMS is indicated by open arrows. B, 1 μg of genomic DNA was digested with 1 unit of S1 nuclease and followed by ligation using T4 DNA ligase. PCR was used to amplify the re-ligated promoter region. The size of PCR product amplified from the untreated control is indicated by the arrow. C, the PCR products in B were sequenced. Nucleotides removed by S1 nuclease are indicated. D, a putative 11G single-stranded loop structure. The sequence numbers shown in C and D are related to the transcription-initiation site (+1).

