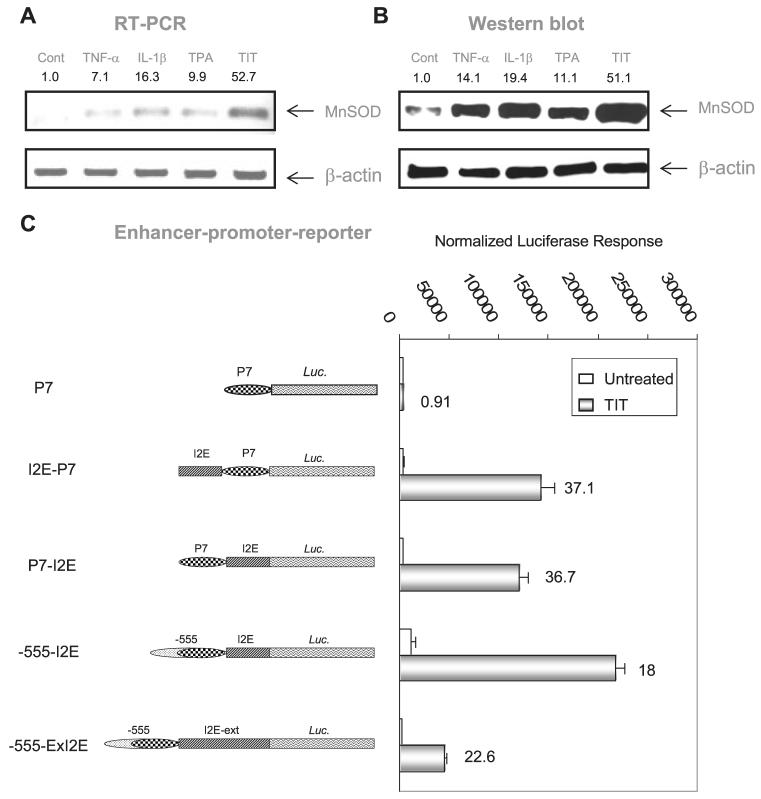
FIGURE 5. Induction of the human MnSOD by TPA and cytokines.
A, MnSOD mRNA was quantitatively analyzed by RT-PCR in response to the treatments. TIT indicates the combined treatment containing TNF-α, IL-1β, and TPA. B, MnSOD protein was measured by Western blots. β-Actin served as a control to normalize MnSOD signals. The relative signals in the treated groups were further normalized by untreated controls. Induction -folds are indicated above corresponding bands in A and B. C, the enhancer region was linked to the promoter regions at different positions or distances as illustrated at left. Each construct containing the enhancer region (0.5 nM) was co-transfected with β-galactosidase (0.1 nM) and followed by TIT treatment. The -fold induction compared with untreated control in different enhancer constructs was estimated by normalized luciferase reporter responses as shown at right.

