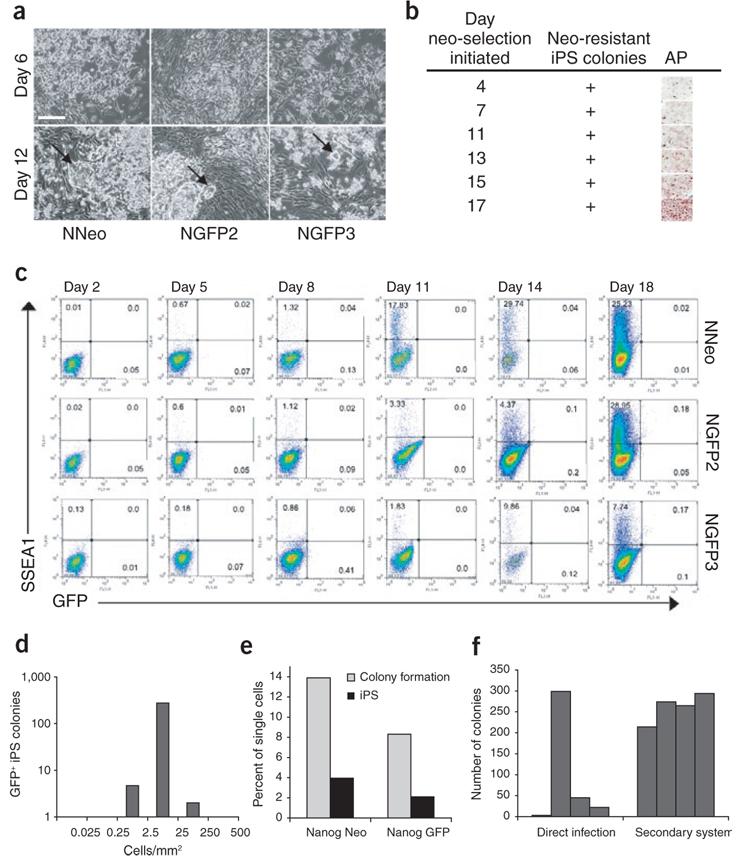
Figure 2. Reprogramming kinetics and efficiencies vary between MEFs from distinct iPS cell lines.
(a) Secondary MEFs from three ‘primary’ iPS cell lines were treated with dox, and reprogramming was monitored visually. The different MEF populations exhibited morphologic differences 6 d after dox administration, but all formed colonies with ES-cell morphology within 12 d (arrows). Scale bar, 250 µm. (b) Neo-resistant and alkaline phosphate–positive colonies were present in NNeo cultures when the drug was added to the media as early as day 4 after dox induction. (c) Flow cytometric analysis for reactivation of SSEA1 and the Nanog-GFP reporter allele (in NGFP2 and NGFP3 lines) over 18 d of dox culture. (d) Secondary NGFP2 MEFs were plated at densities varying from 0.025–500 cells/mm2 followed by dox addition. GFP+ colonies were counted 4 weeks later. (e) Single secondary MEFs were plated in 96-well plates containing a γ-irradiated MEF feeder layer followed by dox induction. The percentage of single cells able to proliferate sufficiently to form a visible colony on the MEF feeder layer (light gray bars) and the percentage of single cells able to form GFP+ or neo-resistant secondary iPS cell colonies (dark gray bars) were scored 4 weeks later. (f) Comparison of the interexperimental variability in iPS cell colony formation efficiency between direct infection and the secondary system. 3 × 10⁵ Oct4-neo MEFs1 derived from a single embryo were infected with the four factors encoded by Moloney-based retroviral vectors on a 10-cm plate, neo selection was initiated on day 6 and resistant colonies were counted on day 20 (left, direct infection). 3 × 10⁴ secondary NGFP2 MEFs derived from one chimeric embryo were plated in a six-well dish, exposed to dox-containing media and GFP+ colonies were counted 3 weeks later (right, secondary system). The bars represent number of colonies in each of the four independent experiments.

