Figure 3.
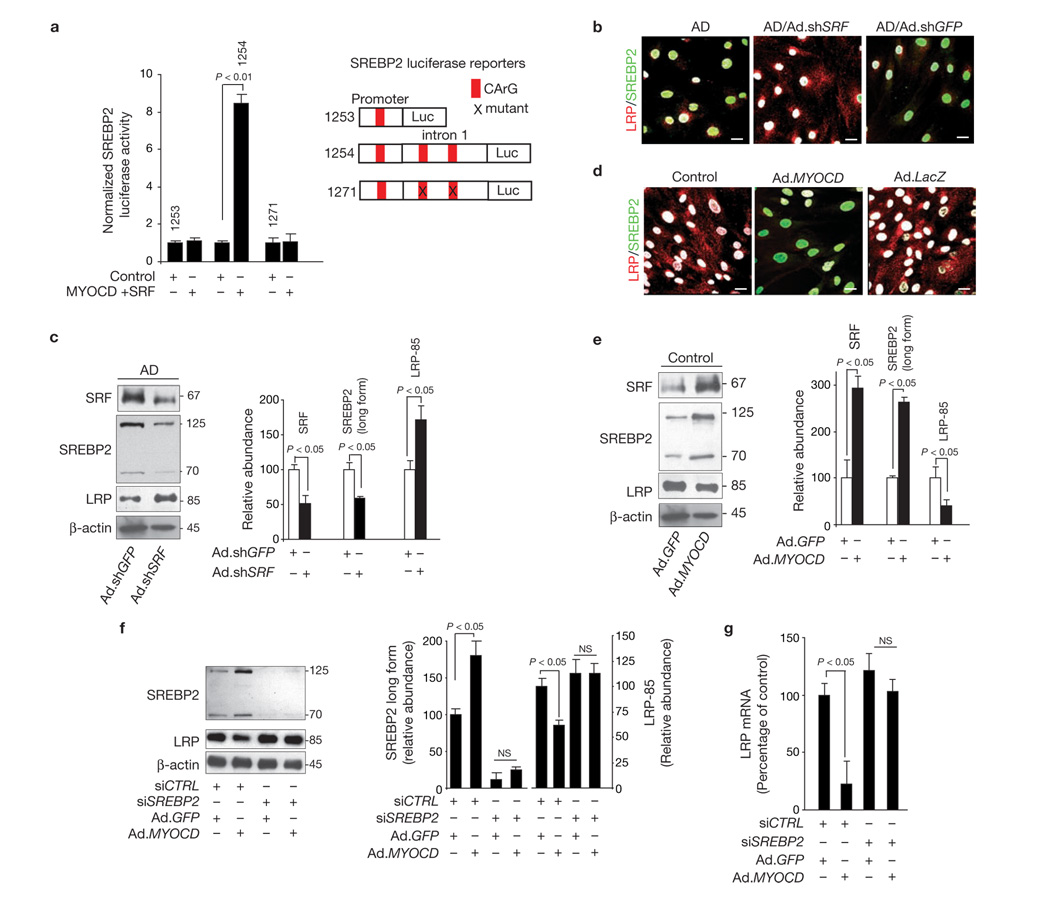
SRF and MYOCD suppress LRP through directed expression of SREBP2. (a) SREBP2 luciferase activity in PAC1 VSMCs after co-transfection with a luciferase reporter containing the promoter (1253), promoter plus intron 1 (1254) or promoter plus intron 1 with both CArG boxes mutated (1271) of human SREBP2, with pcDNA vector and EMSV vector (control) or with MYOCD and SRF overexpression plasmids. (b) Increased levels of nuclear SREBP2 (green) and low cellular expression of LRP (red) in AD VSMCs, compared with control VSMC (see d). Reduced nuclear SREBP2 levels and increased LRP expression after transduction of AD VSMCs with Ad.shSRF but not Ad.shGFP. Nuclear DAPI staining is shown in white. Scale bar, 20 µm. (c) SRF, SREBP2 (cytoplasmic long form and short nuclear form) and LRP levels determined by western blot analysis in AD VSMC transduced with Ad.shGFP and Ad.shSRF. (d) Low levels of nuclear SREBP2 (green) and increased cellular expression of LRP (red) in control VSMCs, compared with AD VSMC (see b). Increased nuclear SREBP2 and reduced LRP expression after transduction of control VSMCs with Ad.MYOCD, but not with Ad.GFP. Nuclear DAPI staining in white. Scale bars, 20 µm. (e). SRF, SREBP2 (cytoplasmic long form and short nuclear form) and LRP levels determined by western blot analysis after transduction of control VSMCs with Ad.GFP or Ad.MYOCD. Graphs in c and e show band density relative to β-actin. (f) SREBP2 and LRP levels in control VSMC transfected with control siRNA (siCTRL) or SREBP2 siRNA (siSREBP2) followed by transduction with either Ad.GFP or Ad.MYOCD. Graph shows band density for test-proteins relative to β-actin. (g) Real-time qPCR for LRP mRNA in control VSMCs transfected with control siRNA (siCTRL) or SREBP2 siRNA (siSREBP2) followed by transduction with either Ad.GFP or Ad.MYOCD. Data represent mean ± s.e.m. of 9 independent cultures; values were normalized to an internal renilla control (a), or mean ± s.e.m. of 3 independent cultures per group (c, e–g). Full scans of western blot data in panel f are shown in Supplementary Information, Fig. S4.

